環境資訊中心外電;姜唯 翻譯;林大利 審校;稿源:Carbon Brief
國際能源署(IEA)13日發表《2020年世界能源展望()》報告。這份長達464頁的展望報告指出,武漢肺炎(COVID-19)造成的動盪將使未來20年全球能源使用存在高度不確定性。
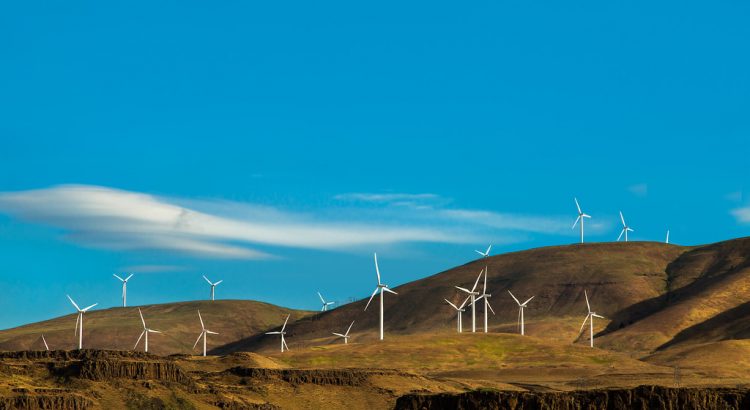
武漢肺炎(COVID-19)造成的動盪將使未來20年全球能源使用存在高度不確定性。照片來源:Sheila Sund(CC BY 2.0)
能源展望報告提供四大情境:四情境下再生能源均顯著成長
今年的報告共提供四個可能途徑或情境,預測到2040年。四種情境中,再生能源全都會顯著成長。在IEA認為最有可能的情境中,到2040年,太陽能產量將比2018年的預期增加43%,部分原因是太陽能價格比預期便宜20至50%。
IEA指出,儘管再生能源成長加速、煤炭結構性衰退,但除非採取更強勢的氣候行動,否則要宣布全球石油使用量達到峰值還為時過早。同樣地,除非全球暖化因應政策加速,否則到2040年天然氣需求可能還會成長30%。
這表示,儘管全球二氧化碳排放量已經達到峰值,但卻遠遠沒有達到穩定氣候所需的達到峰值後快速下降。IEA表示,要實現2050年淨零碳排,需要全球經濟各個層面都使出「洪荒之力」,而非只靠電業。
此次報告的主要途徑仍然是「承諾政策情境」(Stated Policies Scenario, STEPS),即假設政府都能實現自身承諾的情境。不過,IEA對政府是否腳踏實地往目標邁進,有自己的評估。
報告也透過「永續發展情境」(Sustainable Development Scenario, SDS)說明,政府的承諾還需要如何加強才能更加永續。
今年的報告首次詳細模擬了「2050年實現淨零排放的情況」(NZE2050),也就是到2030年,二氧化碳排放量比2010年低45%,2050年實現淨零,並且有50%的機會將升溫控制在1.5°C內,並將說明要實現這個情境需要做哪些事。
最後是「延後復甦情境(DRS)」,即當武漢肺炎疫情持續,全球經濟需要更長的時間來恢復,GDP和能源需求成長急劇下降的情況下,將會發生什麼事。
在所有情境下,再生能源都佔需求成長的最大宗。相反的,隨著全球氣候政策積極度增加,化石燃料成長趨弱,甚至下降。
IEA:太陽能發電現在是有史以來最便宜的電力來源
今年報告最重大的變化之一是,IEA估算了不同發電技術的成本。根據報告,如今的太陽能比IEA去年預測的便宜約20%至50%,具體幅度取決於地區。陸上和海上風電的預估成本也以差不多的幅度降低。
此次的分析以建立新發電容量的開發商的平均「資本成本」為基礎。過去,所有技術資本成本皆為7%至8%,依每個國家的發展階段有所不同。
這次,IEA檢視各種證據發現,太陽能的資本成本要低得多,在歐洲和美國分別為2.6~5.0%,在中國為4.4~5.5%,在印度為8.8~10.0%,主要是因為有減少再生能源投資風險的政策存在。
IEA表示,在最佳地點並有最優惠的政策支持和融資條件,太陽能現在可以「達到或低於」每兆瓦時(MWh)20美元的水準。「對於利用低成本融資高品質資源的計畫來說,太陽能發電現在是有史以來最便宜的電力來源。」
IEA表示,新的公用事業規模太陽能電廠現在在歐洲和美國的成本為30~60美元/MWh,在中國和印度等有保證價格機制的國家只有20~40美元/MWh。
IEA稱,這些成本完全低於新建燃煤電廠的平均成本,並且與中國和印度現有燃煤電廠的運營成本相差無幾。
現在陸上和海上風電被視為可以獲得低成本融資。最新報告對這些技術的成本估算值更低,因為資本成本佔新再生能源開發成本的一半。
再加上過去一年政府政策的變化,IEA將再次上修其對未來20年的再生能源發展預測。
IEA:由於武漢肺炎,煤炭永遠無法從2020年的下降中恢復
到2040年,水力以外再生能源發電量在STEPS中已達到1萬2872TWh(太瓦時),高於今日的2873 TWh,比去年的預期高出約8%,比2018年的預期水平高出22%。
太陽能是其中最大的原因。與2018年世界經濟展望相比,2040年的太陽能產量預測成長43%。相比之下,現在煤炭發電量在結構上低於先前的預測,到2040年的發電量比去年的預測低約14%。IEA稱,由於武漢肺炎的關係,煤炭永遠無法從2020年的8%下降中恢復。
值得注意的是,今年的STEPS中,2040年的天然氣產量也降低了6%,部分也是因為疫情及其對經濟和能源需求增長的長期影響。
整體而言,以太陽能為主力的再生能源滿足了STEPS中絕大部分新電力需求,到2030年將佔再生能源成長的80%,到2025年將取代煤炭成為世界最大的電力來源,超過IEA去年的「加速發展情境」預測。
儘管近幾年煤炭前景不斷下修 仍不到實現氣候目標
IEA表示,從今年的前景看來,太陽能成本更低且成長更快,這表示從2020年開始,每年都將有破紀錄的新太陽能容量。
連續幾版報告都下修煤炭前景,今年的變化尤為明顯,這某種程度上要歸功於武漢肺炎後煤炭需求的「結構性轉變」。
IEA現在認為,未來幾年煤炭使用量會略有上升,但隨後會下降。然而,這樣的軌跡還是遠遠未達到SDS的削減幅度。
綜合上述,再生能源的迅速發展和煤炭結構性下降加總起來,有助於控制全球二氧化碳的排放量。但是,對石油和天然氣使用量的穩定需求讓碳排只會趨於平緩,不到能實現全球氣候目標迅速下降的程度。
在STEPS下,到2040年,再生能源可滿足能源需求成長的3/5,並佔總量的2/5。石油和核能的小幅成長足以抵消煤炭能源使用量的下降。
永續發展情境下 要到2070年才會達到淨零碳排
而在SDS下,到2040年,儘管石油和天然氣仍將是第一和第二大主要能源,但所有化石燃料的使用都將有所減少。相對於2019年的水準,煤炭將下降2/3,石油下降1/3,天然氣下降12%。
同時,其他再生能源(主要是風能和太陽能)將飆升至第三大,在未來20年內增長近七倍(+ 662%)。SDS中,可看到水電(+55%)、核能(+55%)和生質能(+24%)的成長幅度較小,但仍相當可觀。
到2040年,低碳能源將佔全球能源結構的44%,高於2019年的19%。根據IEA,煤炭將降至10%,為工業革命以來的最低水準。
儘管如此,還是要到2070年,全世界才會達到二氧化碳淨零排放。
若要實現2050淨零排放情境 三大因素是關鍵
此次報告花了一整章在撰寫NZE2050,並特別強調未來10年都會繼續更新。
在未來10年間,發電業將是減排的最大貢獻者。但是,能源的使用,如運輸和工業,以及個人行為的變化,也有重要的影響。IEA稱,2030年想要從SDS晉升成NZE2050需要額外減排6.4兆噸二氧化碳,就要靠這三大因素。
在NZE2050情境中,低碳電力將在2030年滿足75%的電力需求,今日這一比例為40%。到2025年,太陽能容量必須以每年約300GW(百萬瓩)的速度成長,到2030年將以近500GW的速度增長,而目前的增長速度約為100GW。
從2019年到2030年,燃煤電廠的二氧化碳排放量將減少75%,這意味著效率最低的「次臨界」燃煤電廠將被完全淘汰,大多數「超臨界」燃煤電廠也將關閉。IEA稱,這個變化大部分將發生在佔目前全球煤炭產能2/3的東南亞。
儘管NZE2050情境中,到2030年,核能將佔零碳發電量成長的一小部分,但IEA指出,「大型核電的超長交貨時間」限制了該技術在這10年間的擴張潛力。
工業碳排放量將減少約1/4,其中電氣化和能源效率功勞最大。光是在「先進經濟體」,在這10年的每個月都有超過200萬戶房屋獲得能效改善。
在運輸業,二氧化碳將下降1/5,這還沒算到2030年會有一半以上的新車是電動汽車,高於2019年的2.5%。
Solar is now ‘cheapest electricity in history’, confirms IEA by SIMON EVANS,JOSH GABBATISS
The world’s best solar power schemes now offer the “cheapest…electricity in history” with the technology cheaper than coal and gas in most major countries.
That is according to the International Energy Agency’s World Energy Outlook 2020. The 464-page outlook, published today by the IEA, also outlines the “extraordinarily turbulent” impact of coronavirus and the “highly uncertain” future of global energy use over the next two decades.
Reflecting this uncertainty, this year’s version of the highly influential annual outlook offers four “pathways” to 2040, all of which see a major rise in renewables. The IEA’s main scenario has 43% more solar output by 2040 than it expected in 2018, partly due to detailed new analysis showing that solar power is 20-50% cheaper than thought.
Despite a more rapid rise for renewables and a “structural” decline for coal, the IEA says it is too soon to declare a peak in global oil use, unless there is stronger climate action. Similarly, it says demand for gas could rise 30% by 2040, unless the policy response to global warming steps up.
This means that, while global CO2 emissions have effectively peaked, they are “far from the immediate peak and decline” needed to stabilise the climate. The IEA says achieving net-zero emissions will require “unprecedented” efforts from every part of the global economy, not just the power sector.
The main WEO pathway is again the “stated policies scenario” (STEPS, formerly NPS). This shows the impact of government pledges to go beyond the current policy baseline. Crucially, however, the IEA makes its own assessment of whether governments are credibly following through on their targets.
The report explains:
“The STEPS is designed to take a detailed and dispassionate look at the policies that are either in place or announced in different parts of the energy sector. It takes into account long-term energy and climate targets only to the extent that they are backed up by specific policies and measures. In doing so, it holds up a mirror to the plans of today’s policy makers and illustrates their consequences, without second-guessing how these plans might change in future.”
The outlook then shows how plans would need to change to plot a more sustainable path.
For the first time this year, the WEO has “detailed modelling” of a “net-zero emissions by 2050 case” (NZE2050). This shows what would need to happen for CO2 emissions to fall to 45% below 2010 levels by 2030 on the way to net-zero by 2050, with a 50% chance of meeting the 1.5C limit.
The final pathway in this year’s outlook is a “delayed recovery scenario” (DRS), which shows what might happen if the coronavirus pandemic lingers and the global economy takes longer to recover, with knock-on reductions in the growth of GDP and energy demand.
The chart below shows how the use of different energy sources changes under each of these pathways over the decade to 2030 (right-hand columns), relative to demand today (left).
Notably, renewables (light green) account for the majority of demand growth in all scenarios. In contrast, fossil fuels see progressively weaker growth turn to increasing declines, as the ambition of global climate policy increases, from left to right in the chart above.
One of the most significant shifts in this year’s WEO is tucked away in Annex B of the report, which shows the IEA’s estimates of the cost of different electricity generation technologies.
The table shows that solar electricity is some 20-50% cheaper today than the IEA had estimated in last year’s outlook, with the range depending on the region. There are similarly large reductions in the estimated costs of onshore and offshore wind.
This shift is the result of new analysis carried out by the WEO team, looking at the average “cost of capital” for developers looking to build new generating capacity. Previously the IEA assumed a range of 7-8% for all technologies, varying according to each country’s stage of development.
Now, the IEA has reviewed the evidence internationally and finds that for solar, the cost of capital is much lower, at 2.6-5.0% in Europe and the US, 4.4-5.5% in China and 8.8-10.0% in India, largely as a result of policies designed to reduce the risk of renewable investments.
In the best locations and with access to the most favourable policy support and finance, the IEA says the solar can now generate electricity “at or below” $20 per megawatt hour (MWh). It says:
“For projects with low-cost financing that tap high-quality resources, solar PV is now the cheapest source of electricity in history.”
The IEA says that new utility-scale solar projects now cost $30-60/MWh in Europe and the US and just $20-40/MWh in China and India, where “revenue support mechanisms” such as guaranteed prices are in place.
These costs “are entirely below the range of LCOE [levelised costs] for new coal-fired power plants” and “in the same range” as the operating cost of existing coal plants in China and India, the IEA says. This is shown in the chart below.
Onshore and offshore wind are also now assumed to have access to lower-cost finance. This accounts for the much lower cost estimates for these technologies in the latest WEO, because the cost of capital contributes up to half of the cost of new renewable developments.
When combined with changes in government policy over the past year, these lower costs mean that the IEA has again raised its outlook for renewables over the next 20 years.
This is shown in the chart below, where electricity generation from non-hydro renewables in 2040 is now seen reaching 12,872 terawatt hours (TWh) in the STEPS, up from 2,873TWh today. This is some 8% higher than expected last year and 22% above the level expected in 2018’s outlook.
Solar is the largest reason for this, with output in 2040 up 43% compared with the 2018 WEO. In contrast, the chart shows how electricity generation from coal is now “structurally” lower than previously expected, with output in 2040 some 14% lower than thought last year. The fuel never recovers from an estimated 8% drop in 2020 due to the coronavirus pandemic, the IEA says.
Notably, the level of gas generation in 2040 is also 6% lower in this year’s STEPS, again partly as a result of the pandemic and its long-lasting impact on economic and energy demand growth.
Overall, renewables – led by the “new king” solar – meet the vast majority of new electricity demand in the STEPS, accounting for 80% of the increase by 2030.
This means they overtake coal as the world’s largest source of power by 2025, outpacing the “accelerated case” set out by the agency just a year ago.
The lower costs and more rapid growth for solar seen in this year’s outlook means there will be record-breaking additions of new solar capacity in every year from 2020, the IEA says.
Successive editions of the WEO have revised down the outlook for the dirtiest fossil fuel, with this year seeing particularly dramatic changes, thanks in part to a “structural shift” away from coal after coronavirus.
The IEA now sees coal use rising marginally over the next few years, but then going into decline, as shown in the chart below (red line). Nevertheless, this trajectory falls far short of the cuts needed to be in line with the SDS, a pathway aligned to the “well-below 2C” Paris target (yellow).
Energy outlook
Taken together, the rapid rise of renewable energy and the structural decline for coal help keep a lid on global CO2 emissions, the outlook suggests. But steady demand for oil and rising gas use mean CO2 only flattens off, rather than declining rapidly as required to meet global climate goals.
These competing trends are shown in the chart, below, which tracks primary energy demand for each fuel under the IEA STEPS, with solid lines. Overall, renewables meet three-fifths of the increase in energy demand by 2040, while accounting for another two-fifths of the total. Smaller increases for oil and nuclear are enough to offset the decline in coal energy use.
The dashed lines in the chart above show the dramatically different paths that would need to be followed to be in line with the IEA SDS, which is roughly a well-below 2C scenario.
By 2040, although oil and gas would remain the first and second-largest sources of primary energy, there would have been declines in the use of all fossil fuels. Coal would have dropped by two-thirds, oil by a third and gas by 12%, relative to 2019 levels.
Meanwhile, other renewables – primarily wind and solar – would have surged to third place, rising nearly seven-fold over the next two decades (+662%). The SDS sees smaller, but still sizeable increases for hydro (+55%), nuclear (+55%) and bioenergy (+24%).
Together, low-carbon sources would make up 44% of the global energy mix in 2040, up from 19% in 2019. Coal would fall to 10%, its lowest since the industrial revolution, according to the IEA.
Despite these rapid changes, however, the world would not see net-zero CO2 emissions until 2070, some two decades after the 2050 deadline that would be needed to stay below 1.5C.
The WEO devotes a full chapter to the NZE2050, with a particular emphasis on the changes that would be needed over the next decade to 2030.
The power sector contributes the largest portion of the savings needed over the next decade (orange wedges in the chart, above). But there are also important contributions from energy end-use (yellow), such as transport and industry, as well as from individual behaviour change (blue), explored in more detail in the next section.
These three wedges would contribute roughly equal shares of the extra 6.4GtCO2 of savings needed to go from the SDS to the NZE2050 in 2030, the IEA says.
The NZE2050 case would see low-carbon sources of electricity meeting 75% of demand in 2030, up from 40% today. Solar capacity would have to rise at a rate of around 300 gigawatts (GW) per year by the mid-2020s and nearly 500GW by 2030, against current growth of around 100GW.
CO2 emissions from coal-fired power stations would decline by 75% between 2019 and 2030. This means the least efficient “subcritical” coal plants would be phased out entirely and the majority of “supercritical” plants would also close down. The WEO says the majority of this decline would come in southeast Asia, which accounts for two-thirds of current global coal capacity.
Although nuclear would contribute a small part of the increase in zero-carbon generation by 2030 in the NZE2050, the IEA notes that the “long lead time of large-scale nuclear facilities” limits the technology’s potential to scale more quickly this decade.
For industry, CO2 emissions would fall by around a quarter, with electrification and energy efficiency making up the largest shares of the effort. More than 2m homes would get an energy efficiency retrofit during every month this decade, in “advanced economies” alone.
In the transport sector, CO2 would fall by a fifth, not including behavioural shifts counted below. By 2030, more than half of new cars would be electric, up from around 2.5% in 2019.
※ 全文及圖片詳見:()
作者
如果有一件事是重要的,如果能為孩子實現一個願望,那就是人類與大自然和諧共存。
於特有生物研究保育中心服務,小鳥和棲地是主要的研究對象。是龜毛的讀者,認為龜毛是探索世界的美德。
延伸閱讀
【其他文章推薦】
※如何利用一般常見的「L型資料夾」達到廣告宣傳效果?
※哪裡買的到省力省空間,方便攜帶的購物推車?
※飲水機皆有含淨水功能嗎?
※錢要花在刀口上,選購隔熱紙前必須知道的九件事 !
※各種升降平台款式?
※(全省)堆高機租賃保養一覽表
※石墨與鑽石區別在哪?
※聚甘新